Nº326 - Chart Accessibility, Typography and Inspiration
/ 1 min read
Table of Contents
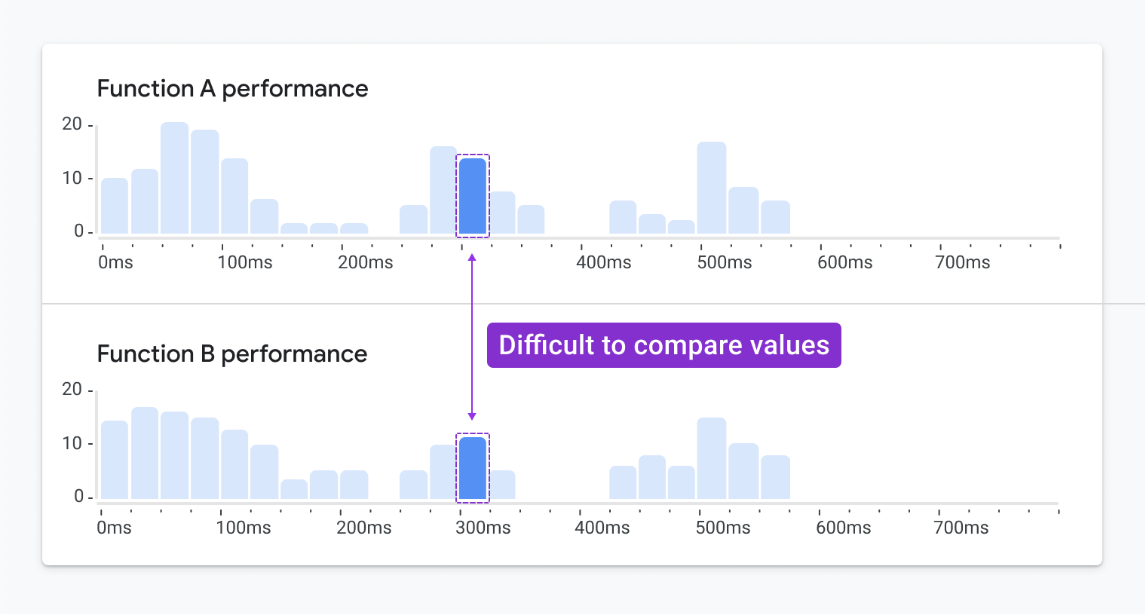
Featured image example of stacked histograms. The values represented by the highlighted bars are difficult to compare to each other.
Links of the week ending 12 August 2022
An Accessibility-First Approach To Chart Visual Design
10 dynamic logo animations you’ll wish you made
Budding new (2022) Designer Bookmarks Telegram Channel
Weekly Design Inspiration #366
Are all connected alphabets ligatures?
How To Bring Your Products To Life With Good UX Design
5 ways content helps create a better user experience
✨ and,
Galeries Lafayette - Play for Good (stunning webgl game)
Disclaimer
lotw.co.uk contains links to and from the third party websites. If you follow a link to any of these websites, please note that these websites have their own privacy policies and that lotw.co.uk does not accept any responsibility or liability for these policies. Please check these policies before you submit any personal data to these websites.